Platform Docker Display: Difference between revisions
| Line 163: | Line 163: | ||
Clicking on one of the services in the planning layer brings up basic schedule details. | Clicking on one of the services in the planning layer brings up basic schedule details. | ||
For more information about understanding platform occupation including trains in the Planning Layer, see | <i> For more information about understanding platform occupation including trains in the Planning Layer, see the [[User Cases]]</i>. | ||
= Train Associations = | = Train Associations = | ||
Revision as of 13:35, 29 July 2020
The Platform Docker primarily displays platform occupation however there are various icons and markers that can also be switched on.
As a reminder: these can be switched on or off via the Docker Viewing Preferences icon. The colour legend can assist a user in remembering what the different items on the platform docker display represent.
Platform Layout
The screen refreshes automatically every 10 seconds.
acumen presents all platforms at the chosen station location and displays current and predicted platform occupation.
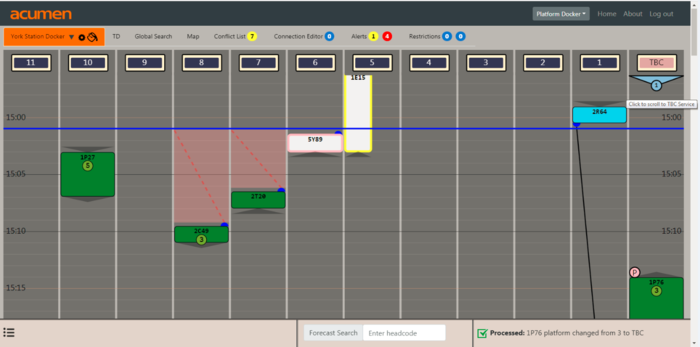
The TBC ‘platform’ on the right-hand side is provided to plot the service where no platform or line has been provided in the timetable (for example, a VSTP), or as a temporary hold when a user is undertaking platform change(s). The number of trains contained within the TBC 'platform' are indicated in the circle. Clicking on the marker takes a user to the first TBC train. A tooltip informs users of this.
Timeline
Time is displayed vertically down the sides of the screen.
The blue horizontal line indicates the current time.
Note: The timeline is linked to the server so the timeline failing to show the correct time is an indication there is an issue with the server. The Support page details who to contact having identified an issue.
The area above the horizontal timeline therefore displays historic (actual) occupation while the area below the horizontal timeline displays future (predicted) occupation.
acumen is configured to display approximately 5 minutes of historic data.
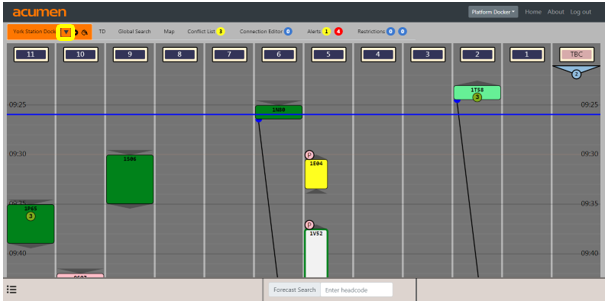
The full platform and line index can be retracted in order to show a greater time period. To do this, click on the triangle next to the docker name which is highlighted in yellow in the image below.
Note: This will hide the any icons informing the lifts, escalators or platform is out of use so may not be a suitable view for all users.
Alerts Bar
The bar at the bottom of the screen displays relevant alerts, warnings, or berth steps to the user. It can also be used to flash system messages – such as health, latency, feed status etc.
The alerts bar displays the last 2 system alerts or notification but can be expanded by clicking on the three bars icon on the left hand side.
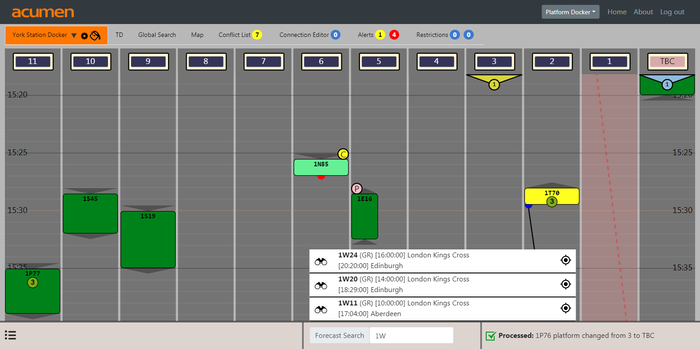
Users can search for a train using the search headcode function in the bottom bar. This is a search of the selected platform docker only (unlike the global search). Clicking on the binocular icon opens the Train Details View. Clicking the location icon on the right hand side jumps down to the train and highlights it.
Bottom right on the alerts bar displays the processing status. This acts as a buffer indication for users when a change is being processed. Changes can take 5 seconds to refresh.
Infrastructure Restrictions
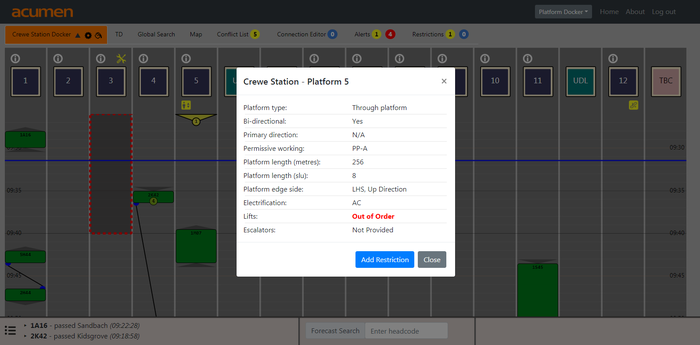
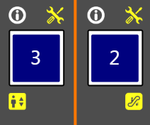
The blue information icon above the platform number provides platform information.
Within the platform information a user can switch the status of the lifts and escalators where these are provided.
Note: Where one lift serves multiple platforms, the status only needs to be switched once, and not for each platform.
The icons below the platform number indicate whether the lifts and/or escalators are out of use.
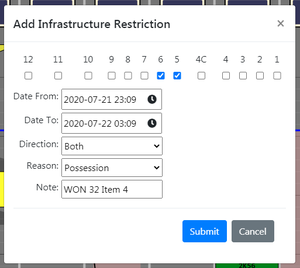
A platform can be marked as out of use by clicking the blue Add Restriction button displayed when the platform information dialogue box is opened. Here the user can set the dates and times between which the restriction applies, the direction in which it applies (Up, Down, Both), the reason for the restriction and any appropriate notes. A user can also multi-select platforms.
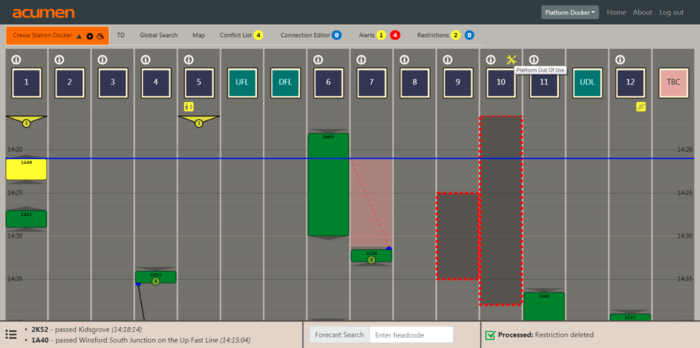
Once submitted and processed, the infrastructure restriction displays as a dark grey box with red dashed border.
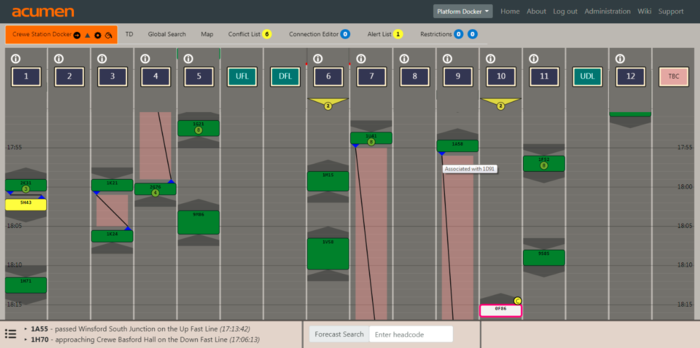
The yellow tools icon (and associated tool-tip) appears above the platform number during the timeframe in which the platform is out of use. In the image below we see the tools icon is displayed for Platform 10 because that infrastructure restriction is in effect, however a tools icon is not yet displayed for the planned restriction of Platform 9.
If there is a train scheduled in the platform during the time of the applied infrastructure restriction, then a conflict will be generated. This acts as a prompt to the user to re-platform that train.
5 minutes before the restriction is due to end, a pop-up alert is displayed to the user in the bottom left hand corner. This alert can be closed by clicking the [x].
A list of all infrastructure (and train running) restrictions can be found within the Restrictions tab. More information can be found here Platform Docker Tabs#Restrictions.
Platform Occupation
Platform occupation is represented by a coloured box/rectangle within the platform boundaries that displays the train headcode.
The height of the box indicates the length of time the train is booked or forecasted to occupy the platform.
The width of the box indicates the portion of the platform being occupied, where this information is received. From left to right the platform portions are A end, Middle (where applicable) and B end.
The box is shaded to indicate the lateness of the service. The colours used are the industry standard CCF colours as listed below.
| Colour | Lateness |
|---|---|
| Magenta | 20 minutes late or more |
| Red | 10 minutes or more, less than 20 minutes late |
| Orange | 5 minutes or more, less than 10 minutes late |
| Yellow | 1 minute or more, less than 5 minutes late |
| Green | Less than 1 minute early to less than 1 minute late |
| Light Green | 1 minute or more, and less than 5 minutes early |
| Blue | 5 minutes or more, and less than 10 minutes early |
| Violet | 10 minutes or more, and less than 20 minutes early |
| Light Pink | 20 or more minutes early |
The box is white if the service has an overdue report. In this instance, the lateness and associated CCF colour instead borders the box.
For stopping services there are directional arrows at the top and the bottom of the box. The arrow on top indicates the direction of travel for which the train arrives at the platform, and the arrow at the bottom indicates the direction or travel for which the train will leave the platform. An arrow pointing upwards represents the Up direction and an arrow pointing downwards represents the Down direction. The length of the arrow represents the platform re-occupation time.
A yellow triangle is displayed when a train is ready to start. The arrow points upwards or downwards depending on the direction.
The circled number within a box is the train consist where this information has been received from DARWIN.
Where a stock splits or joins, this is visually indicated within the train box. For example, here we see 1G09 arrives as an 8-car but departs as a 4-car.
There are several reasons why a pink P may be displayed on a train. A user can hover over the P to see the planned platform.
- 1) In most cases, the pink P indicates that the current platform is different to that received from the CIF. This could be the result of:
- a) a platform change from DARWIN,
- b) acumen moving a next working based on its inbound service,
- c) a user changing platform in acumen, or
- d) an actual report.
- 2) A P will also always display in the TBC column, whether planned or otherwise.
- 3) Additionally, a pink P will display if a TBC is received from DARWIN for that train but the planning intent is known. For example, we know what platform the stock is in however the CIS displays TBC to allow cleaning to take place. In this instance the tool-tip states that CIS has no platform displayed.
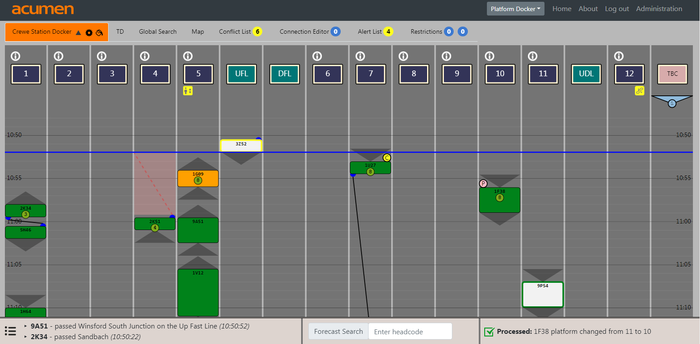
For example, we can interpret the following for Crewe:
- 1G09 is expected to arrive in Platform 5 in two minutes time at 10:54. It is travelling in the Up direction and is between 5 and 10 minutes late. (The tool-tip showed this train as being 5 minutes late.) Information received from DARWIN states 1G09 is formed of 8 coaches. Its expected departure time from Crewe is 10:56.
- 3Z52 is passing through Crewe on the Up Fast line. The white border with yellow box tells us 3Z52 is overdue reporting through Crewe but overall the train is between 1 and 5 minutes late.
- 1F38 is running on time and is formed of 8 coaches. It is travelling in the Down direction and is due to arrive in Crewe at 10:56 and depart at 10:59. The platform for 1F38 has been updated to Platform 10. (The tool-tip informs the planned platform was Platform 11.)
Planning Layer
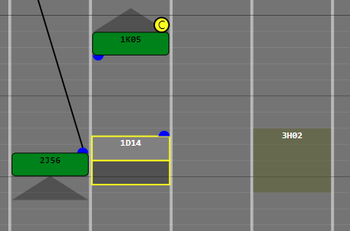
The Planning Layer can be switched on via the docker viewing preferences. When turned on the platform docker will also render trains within the configured time that have not yet been called, and Q&Y paths.
Trains in the plan that have not yet been called will render as a grey box with yellow border. The darker grey box represents the reoccupation time. 1D14 in the figure above is a passenger service that has not yet been called.
Q&Y paths are rendered as shaded boxes without a border. 3H02 in the figure above is a Y path. A Y path will have more than one possible path so when searching for the headcode in the Global Search a user will see multiple entries. A Q path only has one possible path.
Associations for services within the planning layer are also displayed.
Clicking on one of the services in the planning layer brings up basic schedule details.
For more information about understanding platform occupation including trains in the Planning Layer, see the User Cases.
Train Associations
Associations between trains are typically represented by a line connecting blue triangles adjoining the two services with a shaded background. For example, below we see an association between 1K21 and 1K24 in P3. A user can also hover over the blue marker to display a tool-tip of association information as demonstrated on 1A58 in P9.
If the primary train has disappeared from the graph (due to exceeding the 5 minute historic view setting) then the red shaded background is still drawn to indicate the platform occupation, and the tool-tip is accessible on the secondary train but there is no line joining the services.
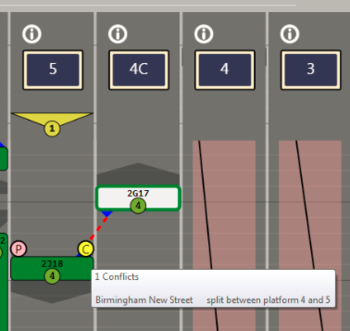
If an association is split across two platforms then a red dotted line marks the association and a split association conflict is raised.
If there is a missing association, a conflict will be raised and a yellow C conflict icon displayed. The tool-tip describes the problem.
Association details can be viewed via the Train Details View and amended with the Associations Editor accessed from the context menu.
